Market Report Week 17 - 23.04.2024

Other insights Apr. 23, 2024

Summary

This week's economic highlights include contrasting GDP growth rates between the USA and Korea for Q1, with Korea's economy accelerating by 2.6% annualized, while the US economy slows to 2.3% growth annualized. Notably, US growth relies heavily on government spending, funded by significant debt expansion, while the price index continues to decline.

Singapore's industrial production rose by 2.3% in March, with the producer price index turning positive, marking a shift after a period of deflation. In Europe, economic sentiment is gradually improving, with Germany's inflation projected to increase to 2.3% in April, though consumer confidence remains negative.

Central banks in Japan, Indonesia, and Turkey are expected to maintain unchanged interest rates. Mexico faces rising inflation, expected to reach 4.5% in April, and a deteriorating trade deficit nearing $3 billion, exacerbated by reduced oil exports.

Investment banks revised oil price forecasts for the second half of the year, anticipating Brent to range from $86 to $95 per barrel, influenced by geopolitical tension. Euroil stock data show fluctuations, with EU-16 fuel oil stocks increasing and middle distillate stocks returning to the five-year average.

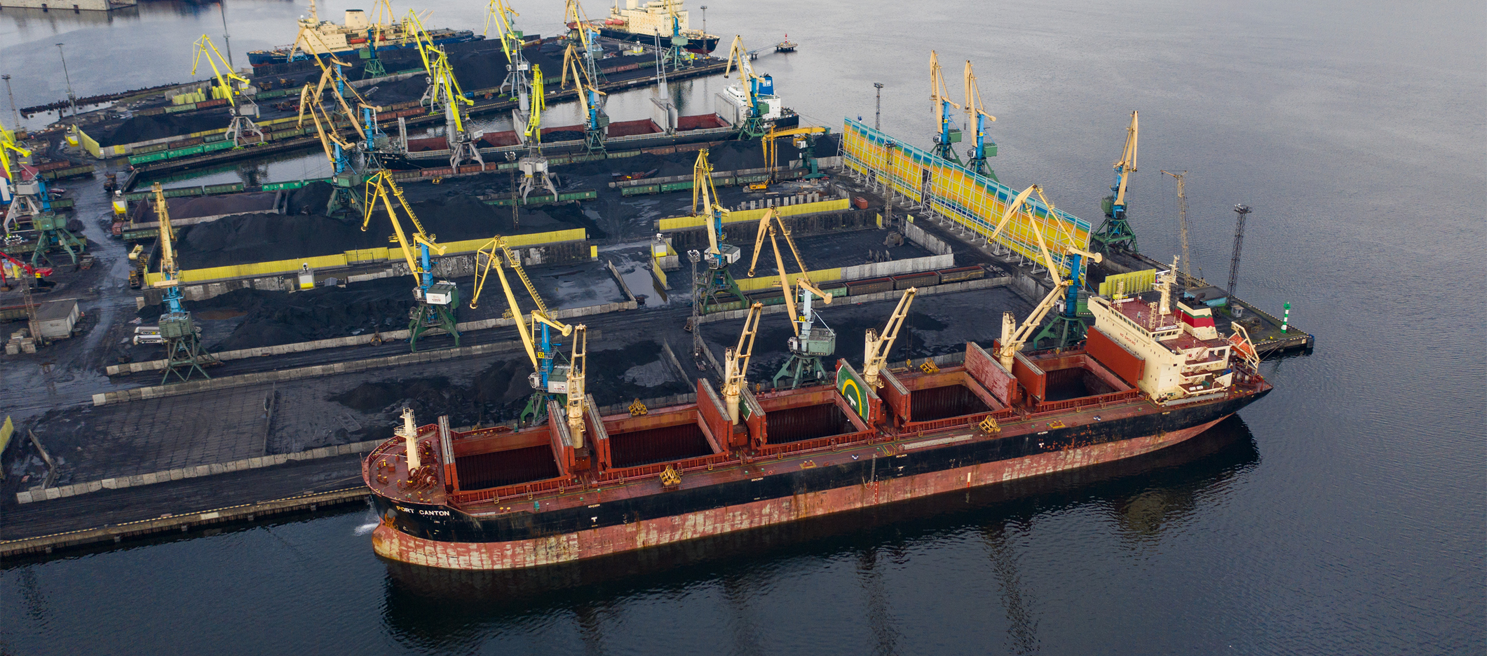
Port activities in Rotterdam and Singapore reflect changing trade patterns, impacted by Red Sea diversions. Singapore reported over 7% growth in cargo throughput in Q1, while bunkering sales rose by 6% year on year.

The IMF World Economic Outlook emphasizes differing growth rates globally, with the Eurozone expected to grow by 0.8%, compared to emerging markets and developing Asia, projected to grow by 5.2% and 6.8% respectively. These trends underscore fundamental changes in the global economy and trade dynamics, with Asia's growth outpacing Europe over many years, reshaping the world economy.

DB Web Fiftyfifty Office 719X719px2

Oil

- Investment banks revise oil price forecasts, projecting Brent to range from $86 to $95/bbl in the second half of the year, citing geopolitical tension's influence on loosening fundamentals.

- Gasoil and fuel oil prices closely track crude oil prices, with strong correlation in forward price structures, though occasional divergence occurs.

- Rotterdam's benchmark 3.5% barges curve reflects market weakness, partly in contango for several months, notably due to high fuel oil stocks in the ARA region.

- ICE gasoil curve, historically in backwardation, shifted to contango at the 6-month horizon, reaching $6, marking a potential turning point indicating market weakness.


- Euroil stock data reveal EU-16 fuel oil stocks rising, while middle distillate stocks return to the five-year average, alongside ARA gasoil stocks, indicating market dynamics and inventory levels.


The Economy

- Rotterdam's Q1 throughput declined by 1.4% to over 110 million tonnes, with liquid bulks representing over 40 million tonnes, including crude oil (25 million tonnes) and oil products (7 million tonnes), both experiencing decreases.

- Energy product shifts were evident, with coal dropping below 5 million tonnes, down over 30%, while LNG increased to over 3 million tonnes, reflecting changes in energy generation patterns.

- Impact of trade pattern realignment and policy choices, notably related to the energy transition, affected port throughput, compounded by Red Sea diversions causing disruptions, with 24% fewer ships calling in Jan-Feb and reduced volume from Asia.

- In contrast, Singapore reported over 7% growth in Q1 cargo throughput, reaching nearly 155 million tonnes, with container throughput rising by almost 8% to nearly 90 million tonnes or 10 million TEU.

- March bunkering sales in Singapore rose by 6% year on year, with Q1 sales growing by 12% to nearly 14 million tonnes, indicating changing economic dynamics and differing growth rates between regions highlighted by the IMF World Economic Outlook, with Europe at 0.8%, emerging markets and developing Asia at 5.2%, and India at 6.8%.


Forward Curves

3.5% Barges R'Dam Curve

Weekly Report 230424 Page 0033

The 3.5% barges’ curve is in contango for the first five months of the curve, but shows a $2 backwardation on the 6-month contract. Contango is nearly $9/mt at the three-month horizon, but shows $2 backwardation at the six-month time-spread. The front fell $5/mt while the six-month fell $10.8/mt.

VLSFO 0.5% R'Dam Curve

Weekly Report 230424 Page 0034

The VLSFO 0.5% backwardation increased $0.3/mt to -$29.5/mt, compared to a week prior.

ICE Light Gasoil Curve

Weekly Report 230424 Page 0035

The ICE Gasoil curve fell $58.5/mt at the front compared to last week in absolute terms The curve moved to contango on the front months. The six-month fell by $40.5/mt. The time spread for the 6-month period decreased over $18/mt to plus $6/mt.

VLSFO 0.5% VS LGO and 3.5% Barges

Weekly Report 230424 Page 0036

The relative value of VLSFO compared to LGO at 6 months was up at 71% and in absolute terms down $22 at -$227/mt compared to 75% or $192/mt below LGO at the front. That $192/mt is down $40/mt on last week’s reading when the front was at 72% of LGO.

Weekly Report 230424 Page 0033 Weekly Report 230424 Page 0034 Weekly Report 230424 Page 0035 Weekly Report 230424 Page 0036

Our point of view

With Venezuelan sanctions back on, although with exemption for Chevron’s deal, and new sanctions on Iran being crafted, the oil market finds itself with further regulatory barriers. As we said many reports ago, the oil will flow anyway. It will just be more expensive. Russia was China’s biggest oil supplier in March, reaching over 2.5 mb/d, up over 12% year on year. The country also recorded imports from Venezuela during the month. For now, the oil price is propped up by political decisions. At this point the financial market’s abbreviation TINA, there is no alternative, still is applicable for oil. The EU is now forced to review its internal combustion exit, with the EU’s auditor saying that the economic bloc’s emission targets cannot be achieved without hurting industry and consumers. And so it goes. The IEA’s off-the-cuff remark that demand growth is back to trend this year, masks the fact that had the previous decade’s growth continued, rather than having a demand fall-out in 2020, demand would have been close to production capacity. It would have crippled the economy. It appears that sharp economic pullbacks are now necessary to slow the consumption of oil.